

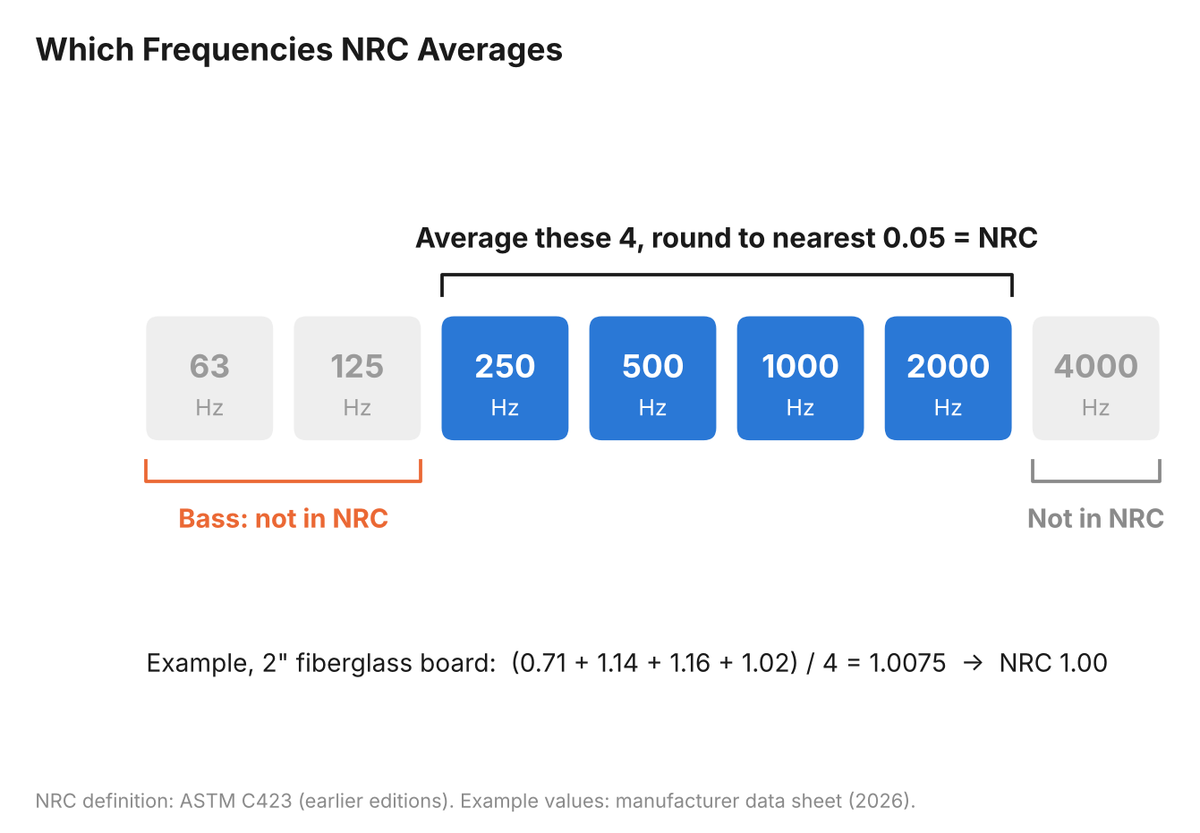
NRC, the noise reduction coefficient, is one number that averages a material's sound absorption coefficients at 250, 500, 1000 and 2000 Hz, rounded to the nearest 0.05. It can be over 1.00 on a lab report. That does not mean the material absorbs more sound than reaches it. It comes from how the reverberation room test measures a sample of limited size.
What Does NRC Mean?
Absorption coefficients come from ASTM C423, the reverberation room method. The lab measures how fast sound decays in a large, hard, reverberant room, first empty and then with the sample in it. The sample adds absorption, so the sound decays faster. The difference is the sample's absorption in sabins. One sabin is the absorption of 1 square foot of perfectly absorbing surface, such as a 1 ft x 1 ft open window.
The absorption coefficient is the sabins divided by the sample's area. In one published Riverbank Acoustical Laboratories report, a 73.5 square foot specimen added 63.94 sabins at 1000 Hz: 63.94 / 73.5 = 0.87.
A coefficient of 0 is no absorption, and 1 is the absorption of an open window of the same area. Data sheets usually list six octave bands from 125 Hz to 4000 Hz, each double the frequency of the one below it.
NRC squeezes that table into one number. Riverbank reports define it, from earlier editions of ASTM C423, as the average of the coefficients at 250, 500, 1000 and 2000 Hz, rounded to the nearest multiple of 0.05.
Later editions of C423 define the Sound Absorption Average (SAA) instead: the average of the twelve one-third octave bands from 200 Hz through 2500 Hz, rounded to the nearest 0.01. SAA covers about the same range in finer steps, and it also leaves out 125 Hz.
- For 2" unfaced 6 PCF fiberglass board (6 pounds per cubic foot, the density used in our panels), the manufacturer's published data sheet gives (0.86 + 1.16 + 1.16 + 1.03) / 4 = 1.0525, which rounds to NRC 1.05.
- The Riverbank report above works the same way: (0.47 + 0.44 + 0.87 + 0.56) / 4 = 0.585, which rounds up to NRC 0.60.
NRC Ignores Bass
Nothing at 125 Hz or below goes into NRC. At 125 Hz a sound wave is 1,125 / 125 = 9 ft long, so it takes a deep absorber to do much with it. Two panels can share an NRC and behave very differently in the low end.
Two published data sheets for 6 PCF board, one fiberglass and one stone wool, list these values. The fiberglass sheet uses Type A mounting (laid directly against the test surface):
| 6 PCF Board | 125 Hz | 250 Hz | 500 Hz | 1000 Hz | 2000 Hz | 4000 Hz | NRC |
|---|---|---|---|---|---|---|---|
| 2" Fiberglass | 0.18 | 0.86 | 1.16 | 1.16 | 1.03 | 0.97 | 1.05 |
| 2" Stone Wool | 0.28 | 0.75 | 1.11 | 1.08 | 1.05 | 1.07 | 1.00 |
| 4" Fiberglass | 0.60 | 1.10 | 1.09 | 1.12 | 1.05 | 0.91 | 1.10 |
| 4" Stone Wool | 0.88 | 0.88 | 1.05 | 1.06 | 1.06 | 1.12 | 1.00 |
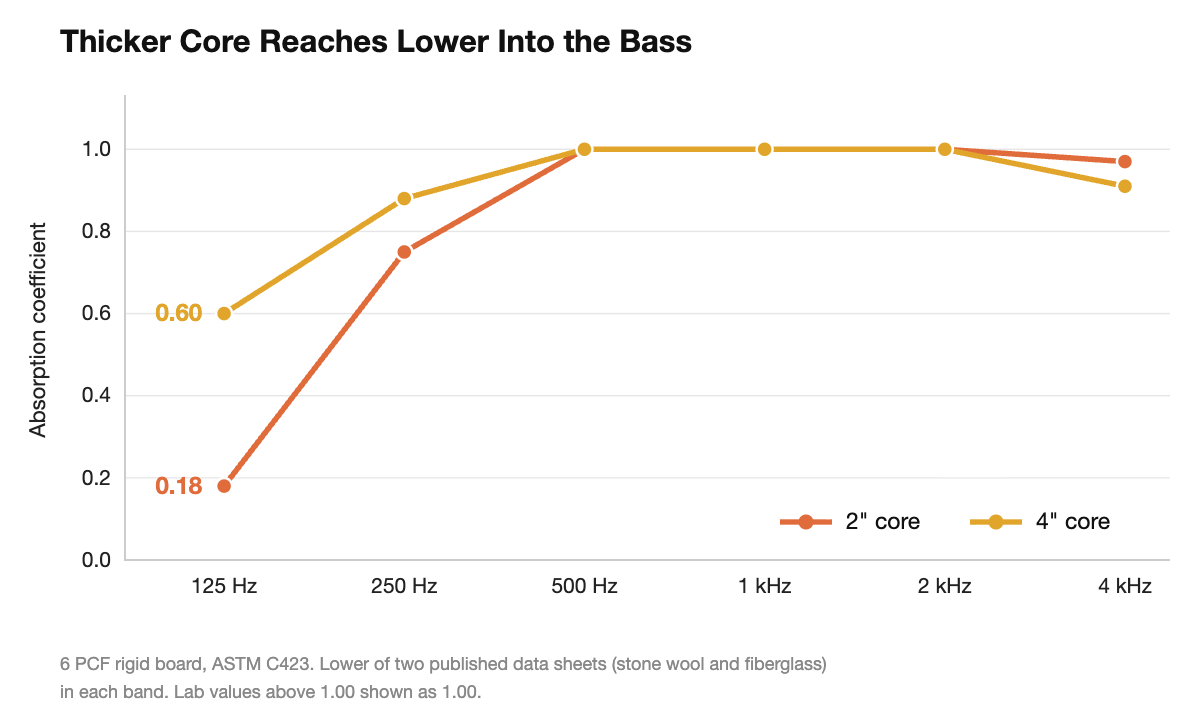
The 2" fiberglass board has a higher NRC, 1.05, than the 4" stone wool board at 1.00. At 125 Hz the 4" board absorbs 0.88 and the 2" board 0.18, a difference NRC does not show.
Across this site we use the lower of the two sheets in each band, capped at 1.00: a 2" core at 0.18 at 125 Hz and 0.75 at 250 Hz, and a 4" core at 0.60 and 0.88. On those numbers the 4" core absorbs more than three times as much at 125 Hz, while each sheet's NRC moves by 0.05 or less from 2" to 4".
The reason is where a porous absorber does its work. At a hard wall the air particles can't move, so their velocity is zero at the wall surface and peaks a quarter wavelength out. Porous material absorbs by friction with moving air.
At 125 Hz a quarter wavelength is 9 ft / 4 = 27", so every added inch of thickness reaches further into air that is moving. We cover this in more detail in why thin panels don't fix bass.
NRC can also rank materials backward for bass. The fiberglass sheet lists 2" 6 PCF board with a foil reinforced kraft (FRK) facing at NRC 0.60, lower than the unfaced board's 1.05. Its 125 Hz coefficient is 0.42, more than twice the unfaced board's 0.18. The facing gives up highs instead: 0.36 at 4000 Hz against 0.97. Sorting by NRC alone would pick the board with less absorption at 125 Hz.
Can NRC Be Over 1.00?
Yes, on paper. A coefficient of 1.00 means the sample absorbs as much as an open window of the same area. Values above that come from the test method.
The coefficient is sabins divided by the sample's geometric area, the length times the width of its face. ASTM C423 states that diffraction effects usually make the apparent area of a specimen greater than its geometric area, which raises the measured coefficients, and that when the specimen is highly absorptive the values may exceed unity.
Sound near the edges of the sample bends toward it, so the sample draws in sound from a larger area than its face. The sabins go up, the area in the division stays the same, and the coefficient can land above 1.00.
A 2023 review in Acoustics Today calls this the edge effect, caused by diffraction at the edges of the test specimen. The authors note that measurements under the current ISO 354 and ASTM C423 apply no correction for it. ISO 11654 handles it with a practical absorption coefficient that is truncated at 1.00.
A 2015 NASA report on highly absorptive foam measured coefficients above 1.0 and attributed them to the same diffraction edge effect.
Sample size plays into it. A 1947 National Bureau of Standards circular stated that, owing to diffraction, the smaller the dimension of a sample, the greater its apparent sound absorbing power.
So an NRC over 1.00 tells you a thick, porous absorber did well in the four middle bands. The fiberglass sheet above shows plain 2" and 4" board at NRC 1.05 and 1.10. A number over 1.00 is normal for porous material that thick.
Mounting Changes the Number
ASTM E795 sets the mountings used in C423 tests. It states that the absorption of a material covering a flat surface depends on the way it is mounted as well as on the material itself. The two you will see most:
- Type A: The specimen is laid directly against the test surface. This is the closest lab match to a panel hung flat on a wall.
- Type E-400: The specimen is held in a fixture with its exposed face a set distance from the test surface. The number is that distance in millimeters, so E-400 is 400 mm, about 16" from the face of the specimen to the surface behind it.
The 1947 NBS circular gave the general rule: the greater the airspace behind a material, the greater its sound absorption. A panel tested at E-400 and a panel tested at Type A are not on equal footing. Check the mounting before you compare two NRC figures.
In a home, wall panels hang flat on Z-clips or cleats with about 1/2" to 1" behind them, so Type A is the closest lab match. Following the NBS rule above, that small gap adds a little low frequency absorption over the Type A figure.
Ceiling clouds are the one place a real air gap is common, usually several inches to about a foot. That is less air than E-400, so an E-400 figure overstates a cloud hung a few inches down.
How to Read an Acoustic Panel Data Sheet
- Full Table: Ask for coefficients from 125 Hz to 4000 Hz. One NRC figure is not enough to compare panels.
- 125 Hz: If bass is your problem, this is the column to compare. Thickness drives it. In the table above, going from a 2" to a 4" core takes 125 Hz from 0.18 to 0.60. See our bass traps.
- Mounting: Match it to how you will hang the panel. Type A for wall panels on Z-clips or cleats. An air space mounting such as E-400 reads higher than the same material flat on the wall.
- Test Method: Look for an ASTM C423 report from a named lab, with the report number, specimen size and mounting on it.
- Over 1.00: Read it as a thick absorber doing well in the middle bands, with the edge effect included. Two values above 1.00 do not rank one panel over the other.
- Thickness: Our broadband vs mid / high post explains how a 4" core and a 2" core differ, and our guide to how many acoustic panels you need covers how much wall to treat.
Sources
- ASTM International, ASTM C423-23, Standard Test Method for Sound Absorption and Sound Absorption Coefficients by the Reverberation Room Method, ASTM International, 2023.
- ASTM International, ASTM E795-16, Standard Practices for Mounting Test Specimens During Sound Absorption Tests, ASTM International, 2016.
- ASTM International, ASTM E795-05(2012), Standard Practices for Mounting Test Specimens During Sound Absorption Tests (preview with Type A and Type E definitions), ASTM International, 2012.
- Riverbank Acoustical Laboratories, Test Report RAL-A22-358, ASTM C423-22, Type A Mounting, 2022.
- Manufacturer published Product Data Sheet: Rigid Fiberglass Board, ASTM C423 Type A Sound Absorption Coefficients, Pub. 10021736, 2026.
- Manufacturer published Technical Data Sheet: 6 PCF Stone Wool Multipurpose Board, ASTM C423 Sound Absorption, 2026.
- J. Balint, M. Berzborn, M. Nolan and M. Vorländer, Measuring Sound Absorption: The Hundred-Year Debate on the Reverberation Chamber Method, Acoustics Today 19(3), Acoustical Society of America, 2023.
- W. O. Hughes, A. M. McNelis, C. Nottoli and E. Wolfram, Examination of the Measurement of Absorption Using the Reverberant Room Method for Highly Absorptive Acoustic Foam, NASA Glenn Research Center, 2015.
- National Bureau of Standards, Letter Circular LC870, Sound Absorption Coefficients of the More Common Acoustic Materials, U.S. Department of Commerce, 1947.
- Encyclopaedia Britannica, Sabin, unit of sound absorption.
Need a Second Opinion?
Send us your room dimensions, photos and what you're hearing through our free room review form. Our panels and bass traps are built to order in North Los Angeles in 50 fabric colors. Reach out to us for design assistance.